

Landing Impact Load Analysis and Validation of a Civil Aircraft Nose Landing Gear

1
School of Astronautics, Harbin Institute of Technology, Harbin 150001, China
2
Shanghai Aircraft Design and Research Institute, Shanghai 201210, China
*
Author to whom correspondence should be addressed.
Aerospace 2023, 10(11), 953; https://doi.org/10.3390/aerospace10110953
Submission received: 8 October 2023
/
Revised: 6 November 2023
/
Accepted: 8 November 2023
/
Published: 12 November 2023
(This article belongs to the Special Issue Landing System Design in Aerospace)
Abstract
:Landing impact load design is essential, but the process has rarely been fully described, and some designers have even neglected the differences between wheel-axle and ground-contact loads, as well as loads in the longitudinal direction, especially in experimental validations. In this paper, the entire design process of a nose landing gear is addressed, including a theoretical analysis of the unit and its experimental validation. In the theoretical analysis, a mathematical model of a two-mass system with four degrees of freedom was adopted, a computer simulation model was built accordingly, and a preliminary analysis was subsequently conducted to analyze the landing impact loads, verify the landing gear performance, and gauge the difference between the wheel-axle and ground-contact loads. For the experimental validation of the gear, a landing gear drop test was conducted in an optimized manner that emphasized pre-test preparation and during-test wheel-axle load measurement. The test results showed that both the vertical and less studied longitudinal loads, as well as the wheel-axle and ground-contact loads, had good agreement with the analysis; thus, the model, the tool, and the preliminary design were considered to be experimentally validated.
1. Introduction
The landing gear is the key to ensuring the safe landing of an airplane. To reduce the landing impact loads, different kinds of methods have been tried, of which the oleo-pneumatic shock absorber is the most used because of its high energy absorption efficiency, but the landing dynamic process is still complicated. Because the landing impact load is the basis for the structural design of the landing gear and fuselage, in order to ensure the accuracy and rationality of the loads, related theoretical analyses, simulation tools, and experimental tests have attracted a lot of attention from industry and academia.
Theoretical studies have evolved from being linear to being nonlinear, from being simple to complex [1,2,3,4]. In terms of mathematical and mechanical modeling, the most common choice is the two-mass model system with various degrees of freedom, which is typically a set of second-order nonlinear differential equations. Numerous studies have been conducted on the fundamental components of the system, including the air spring force, oil damping, bearing friction, tire deflection, wheel rotation, tire friction, structural arrangement, and structural flexibility [5,6,7,8,9,10,11,12,13]. Some studies have even looked at the impact from the aircraft level, like airframe flexibility, aerodynamics, and the controller systems effect [14,15,16,17,18]. Nowadays, theoretical modeling and simulation analyses are still crucial areas [19,20,21].
Solving the theoretical models of complex nonlinear mathematical equations by hand is complicated, so it is generally inseparable from computer-aided support. Simulation tools can be created by building specific computer programs, like GearSim [22,23], or using generic business multibody dynamics software like MSC.ADAMS and LMS.Virtual.Lab [3,24]. The latter has been the focus of research in recent years and is gradually maturing thanks to quickly expanding computational multibody technology and virtual prototyping technologies [25].
Experimental research has mainly been conducted via landing gear drop tests, which simulate the landing impact process to verify the landing gear design by releasing the test unit from a set height and therefore dropping it so that it impacts the test table below (force measuring platform) to gauge dynamic characteristics [26,27]. In the early days, engineers used time history loads after obtaining them through testing as a design reference for a variety of landing scenarios [28]. After the drop tests started to make more sense and the level of theoretical analysis gradually improved, it was eventually viewed as a final stage to confirm and verify the theoretical analysis instead of being used as a benchmark to expand to other scenarios. As for the development of modern large civil aircraft, airworthiness authorities like the FAA, EASA, and CAAC have made it clear in their regulations that drop test validation activities must be taken seriously. In the last ten years, various experts have conducted test research. Xue Caijun conducted a drop test for the Seagull-300 aircraft [29]; D. Scoot Norwood conducted a full aircraft landing test for F-35 fighters [30]; Zhang Zihao researched drop test equipment [31]; Fang Wei carried out a four-wheeled landing gear drop test [32].
Although extensive research has been conducted in this area, there is still ample opportunity for further improvements and implementation. Some research might neglect the distinction between wheel-axle and ground-contact loads, and some tests have prioritized vertical loads at the expense of longitudinal loads, and in such tests, researchers have alternatively attempted to tackle the complexity of longitudinal loads using rudimentary engineering methods [27,33,34,35]. In the case of advanced large civil aircraft, the landing gear design and the landing load design need to be as accurate as possible in order to ensure safety and save money, but very few studies on this have been published.
This paper presents a practical study of the landing load design process for a large civil aircraft’s nose landing gear, encompassing an initial theoretical analysis and a subsequent validation drop test, thus providing a good reference for further research in this field. For this study, some meaningful investigations and innovations were made. All processes were systematically carried out in accordance with the latest airworthiness requirements and were somewhat advanced. Firstly, the analysis basis of the theoretical mathematical model and the computer simulation tool were studied. After conducting a preliminary analysis, the performance indexes of load factor and energy-absorbing efficiency were verified, and then the load difference between the wheel-axle (WA) center and the ground-contact (GC) point was discussed. Secondly, a landing gear validation drop test was conducted in an optimized way that focused more attention on the activities that needed to be prepared before the test as well as the load measurement during the test. The test results showed that both the loads at the WA center and GC point and both the loads in the vertical and longitudinal directions showed good agreement with the analysis result. The landing impact loads, the performance indexes, the mathematical model, and the simulation tool were all experimentally validated.
2. Theoretical Model and Tool
2.1. Landing Gear Structure
The civil aircraft considered in our research for the creation of this paper is a single-aisle civil aircraft, like the Airbus A320, with a maximum capability of 170 passages, a maximum take-off weight of 80,000 kg, and a maximum landing weight of 68,000 kg. It adopts a typical three-point landing gear layout in which a single-strut two-wheeled nose landing gear carries about 10% of the weight, adopting a typical type of oleo-pneumatic shock absorber. Performance indexes are aimed so that the vertical overload factor should be less than 1.70, and the energy absorb efficiency should be greater than 65%.
The structural outline diagram is shown in Figure 1. It contains an outer cylinder, a piston, a drag brace, a locking stay, two torsion links, and two wheels. The wheel axle is integrated at the bottom of the piston and symmetrically mounted with two wheels. The oleo-pneumatic shock absorber chamber is formed by the outer cylinder and piston, as shown in Figure 1. This is a classic single-chamber design for an oleo-pneumatic shock absorber, with fixed oil orifices and a variable-section metering pin. During the instroke and outstroke movement, the gas in the chamber is compressed or expanded, resulting in different spring forces. Meanwhile, the oil passes through the orifice with different sections and speeds, resulting in different damping forces. In the landing impact process, two forces work synergistically to reduce impact, decrease loads, dissipate energy, and improve comfort.
2.2. Landing Dynamic Model
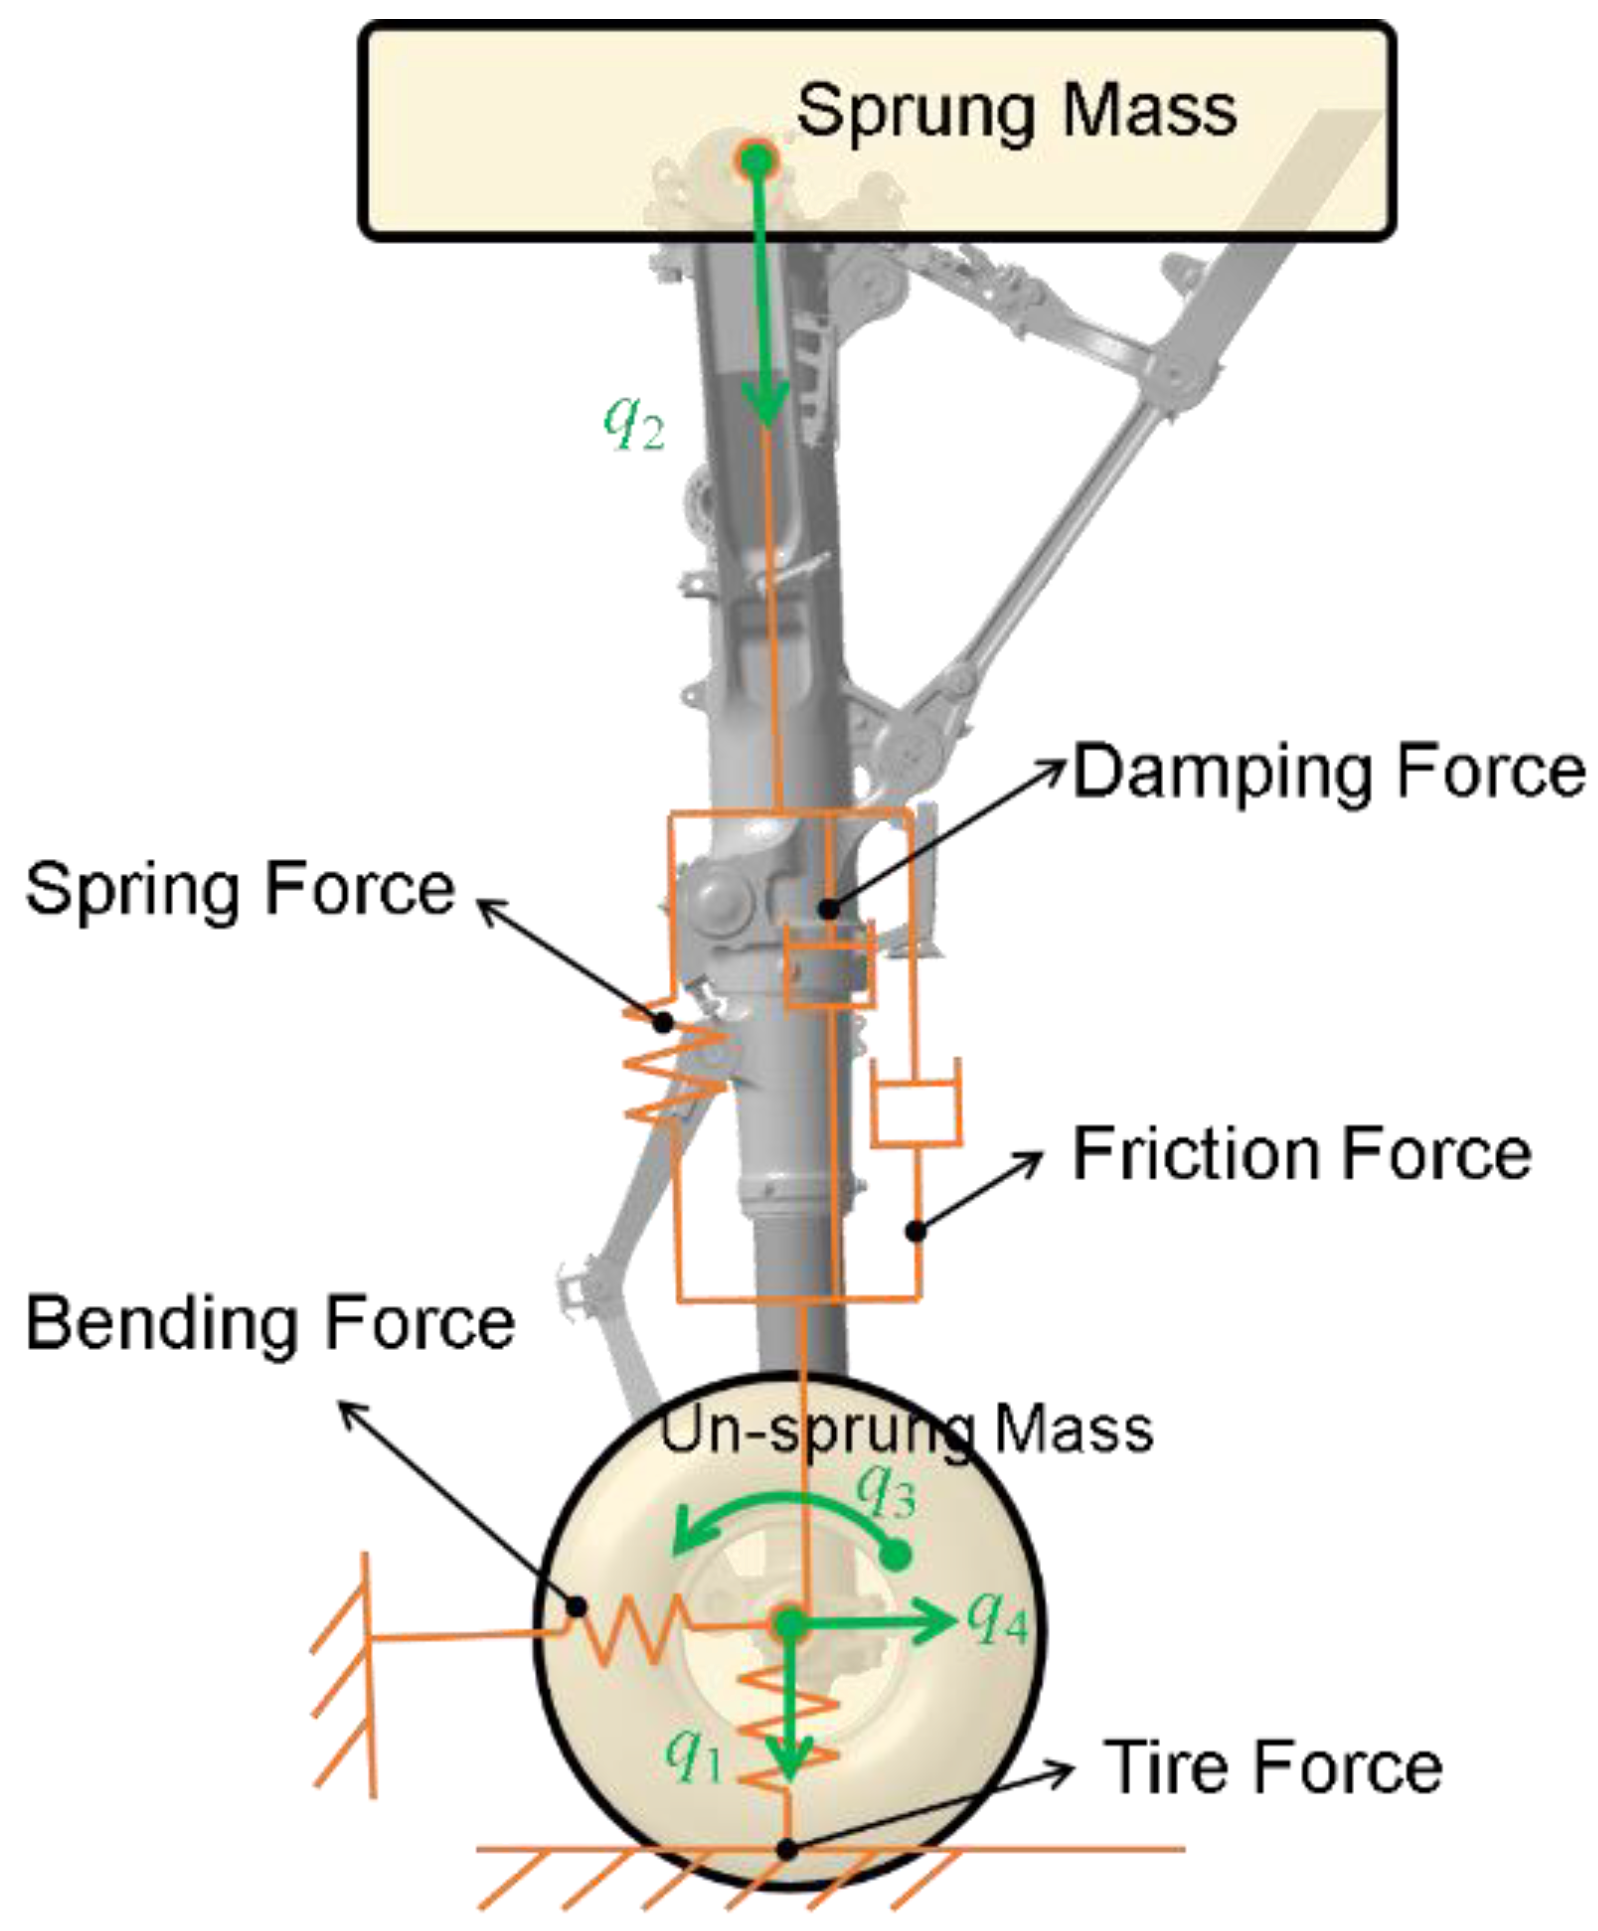
Based on industry experience with respect to meeting airworthiness regulations, some reasonable assumptions of the landing dynamic model can be used, and some reasonable simplifications can be made. The airframe can be treated as rigid, the landing attitudes can be assumed to be symmetrical without rolling, and the airlift force can be assumed to be equal to gravity. A two-mass spring-damper mathematical model with four degrees of freedom (DOF) for the nose landing gear was adopted in this study. A diagram of the two-mass landing gear dynamic model, in which the two masses, DOF, and forces are labeled, is provided in Figure 2.
The un-sprung mass includes the piston, wheels, and lower torsion link. Its center of gravity (C.G.) is assumed to be located at the wheel axle center. The rest of the reduced mass is the sprung mass. The reduced mass of the landing gear is equal to the vertical component of the static reaction, assuming that the mass of the aircraft acted at the C.G. and exerted a force of 1.0 g downward and 0.25 g forward [36]. The four degrees of freedom are as follows: q1 is the up and down of the un-sprung mass, q2 is the up and down of the sprung mass, q3 is the wheel rotation, and q4 is the forward and afterward of the un-sprung mass, namely the gear walk phenomenon caused by strut flexible bending. The corresponding mass definitions are as follows: m1 and m4 represent the un-sprung mass, m2 represent the sprung mass, and m3 is the inertia moment of wheels.
The dynamic model can be defined by the following equations:
where QV is the vertical load inside the shock absorber, consisting of the gas spring force, oil damping force and bearing friction forces; FT is the vertical load on the tire; DT is the longitude friction on the tire; L is the airlift force assumed to be equal to the gravity of the reduced mass; QH is the strut bending force; b is the fixed pitch angle of the pillar; R is the tire radium; d is the tire deflection; g is the gravity coefficient.
Additionally, the detailed equations of the friction forces and bending force are as folllows:
where f is the function of tire friction coefficient and skip ratio, which refers to MIL-A-8863B(AS) if not specified; s is the skip ratio of the tire; L1 is the distance between the upper and lower bearing; L2 is the distance between the lower bearing to the wheel axle center; μ is the bearing friction coefficient; S is the shock absorber stroke; k is the structural stiffness in the bending direction; c is the structural damping coefficient (assumed to be 5%).
2.3. Landing Analysis Tool
The mathematical equations can be solved with known initial motion conditions and design parameters via numerical integration. The motion condition parameters are the geometry position and velocity for each DOF, depending on the landing scenarios. The design parameters, including the masses, spring and damping performance, geometry sizes, and structural stiffness, are frozen after finishing the structural design.
Solving the equations by hand is not easy; thus, MATLAB/Simulink R2013a software was used to build a simulation model according to the mathematical equations, through which the landing impact process can be automatically simulated and solved using the method of numerical integration. This model is shown in Figure 3.
In the tire deflection block, the tire deflections and slip ratios can be calculated. In the tire force block, the vertical and friction tire loads can be calculated. In the SA displacement block, the wheel-axle center’s movements and velocities in two directions can be calculated. In the SA force block, the WA center forces in the strut direction and bending direction can be calculated. In the DOF block, the displacements, the velocities, and the accelerations for each DOF can be integrated and calculated according to the iteratively updated forces.
3. Preliminary Analysis
3.1. Analysis Cases
The input data of the landing conditions for the analysis were defined by the initial motion states and aircraft design parameters. Regarding the airworthiness requirements, various combinations of the weights, C.G. conditions, landing attitudes, and landing speeds should be considered. The weight and C.G. are used to calculate the reduced mass. The landing attitude of the nose landing gear is the three-point level landing. The sinking speed is 1.83 m/s for the maximum take-off weight and 3.05 m/s for the maximum landing weight. According to the regulations, the maximum longitudinal speed is 1.25 times the stall speed corresponding to the highest permitted landing height. In contrast, the minimum longitudinal speed is the stall speed corresponding to sea level altitude. Given the challenging conditions of an icy or wet runway, an equivalent technique of setting the minimum longitudinal speeds to zero was selected for this study. In addition, to ensure the comprehensiveness of the design, more combinations may be added by different manufacturers for different purposes, resulting in hundreds of combined conditions. We used the severe conditions listed in Table 1 as examples.
The input data of the landing gear design parameters mainly included the gas spring curve, oil damping coefficient curves, tire deflection curve, and tire friction–slip curve, as shown in Figure 4. The other parameters, like the un-sprung mass, wheel rotation inertia, strut bending stiffness, and other geometry information, were gauged from the three-dimensional geometric model and finite element model (FEM).
3.2. Performance Verification
After our preliminary analysis, the values of the ground-contact vertical loads and the travels of the sprung mass were calculated, and the results are shown in Figure 5. The figure shows the variation in the vertical loads relative to the travels, the maximum loads and the maximum compressions, and how the landing gear absorbed impact energy in the first compressions. These data were used to verify whether the landing gear’s performance in terms of the overload factor and energy absorbance efficiency was theoretically adaptable.
The overload factor is the ratio of the maximum vertical load to the reduced mass weight. The maximum loads for cases A1, A2, and A3 are 215 kN, 210 kN, and 212 kN, respectively. The overload factors are 1.63, 1.60, and 1.61, given the drop mass of 13,400 kg. This shows that the landing gear design is capable of meeting the overload factor requirement that the maximum should be lower than 1.70.
The shock absorber (SA) efficiency is a factor that describes the ability of an element to absorb impact energy, and it can be calculated using the following equation:
where QV is the vertical force along the strut direction; S is the stroke travel; QVM is the maximum vertical force; Sm is the maximum stroke. The results corresponding to cases L1, L2, and L3 were 65.3%, 67.6%, and 68.8%. This shows that the shock absorber efficiency of the gear can meet the minimum shock absorber efficiency requirement (greater than 65%). Compared to the other cases [4,8,17,33], the curve shapes and the absorber efficiencies are basically similar. However, if the vertical loads before 250 mm can be optimized from 100 kN to about 150 kN by redesigning the damping parameter, the absorber efficiencies may be better.
3.3. WA and GC Loads
The preliminary analysis results regarding history loads, which include the two positions of the wheel-axle center (WA) and ground-contact point (GC) and two directions (the vertical and longitudinal directions), are shown in Figure 6.
The key finding that was derived from these results is that faster longitudinal speeds produce more dramatic longitudinal loads, in which both the values and frequencies undergo changes, but the vertical loads are not that dramatic. What is more important is that the load difference between the WA and GC is clearly non-negligible. The WA loads have noticeable oscillation, with a frequency of around 20 Hz, but the GC loads decay rapidly, more like a shock wave. This should serve as a reminder for engineers to accurately analyze the wheel-axle loads rather than the ground-contact loads to support static load selection and the structural strength of the design. Similarly, the same difference in importance should also be noted in the landing gear drop test.
4. Drop Test Validation
4.1. Test Facility and Preparation
As seen in Figure 7, the major components of the landing gear drop test facility included a column platform, a mass skip basket, an impact reaction table, a wheel speed-up system, airlift rods, and measuring tools. The landing gear test unit was fixed to the skip structure (skip basket), which modified the drop mass by carrying different weights of iron blocks like a basket. The test unit could be lifted to a set height to obtain an accurate impact velocity before being released and therefore dropped on to the table after the wheels were accelerated. When the tires made contact with the table, the airlift rods, which are not shown in the figure, provided a stable lift force.
Traditionally, the dynamic parameters, such as the loads, pressures, displacements, velocities, accelerations, and temperatures, are measured and calculated with high sampling during the drop impact process, in which the table forces are usually the focus of attention. Three-dimensional load sensors were installed under the impact table to measure the ground-contact loads. The absorber’s instroke, basket skip displacement, and tire deflections were measured using displacement and velocity sensors.
Additionally, to measure the wheel-axle forces, our drop test also included the installation of load sensors to the attachment points for the season that the load transfer from the wheel-axle to the attachment points was clear after releasing the pressure inside the retraction actuator namely that the total loads of all the attachment points were equal to the wheel-axle loads. Additionally, to obtain wheel rotation information, two rotational speed sensors and a tire deflection sensor were also installed to measure the linear speeds at the ground-contact point, which can be used to determine the slip ratios. Because that longitudinal loads, a key point of focus in this study, are highly correlated with slip ratios and tire friction coefficients.
Another critical aspect of our study was the preparation for the test, which mainly involved confirming the design parameters, including the air–spring curve, test unit weights, drop masses, and the wheel moment of inertia. Particular attention was paid to confirming the element’s structural stiffness, which was critical for the wheel-axle load analysis. This was measured via finite element modeling analysis, in which the beam model shown in Figure 8 was verified via a static load test.
4.2. Test Cases
The primary goal of our drop test was to confirm that the landing gear dynamic characteristics and design indexes meet expectations per the requirement of EASA CS25.723 and to ensure that the simulation analysis model and tool were valid for various landing design conditions. The test criteria were the drop mass and sinking speeds, which needed to be equal to or slightly larger than the theoretical value to provide sufficient impact energy. Typically, heavy load situations with high-impact energy were chosen for the test cases, and at the same time, various longitudinal speeds were considered. The landing conditions of the preliminary analysis (Table 1) were selected as the drop test cases. The test results are shown in Table 2, and each case met the energy criteria.
4.3. Processing of Test Results
After the test, the verification and validation process mainly consisted of tuning uncertain parameters and comparing the loads and performance indexes. Overall, the results indicate that the preliminary analysis results regarding the loads and performance are accurate, reasonable, and acceptable, meaning that they were validated by the drop test. In addition to the loads, the theoretical model and simulation tools were also considered to be valid.
4.3.1. Parameter Tuning
Uncertain parameters were tuned to accurately define parameters such as the gas polytrophic factor, discharge coefficient, and bearing friction coefficient, which were initially defined according to our engineering experience in the preliminary analysis stage but were tuned following the drop test for further usage. The parameters were first tuned for each case, and then a typical result was determined via a comprehensive judgment based on the principle that the history loads for each case are in relatively good agreement; meanwhile, the analytical loads were slightly conservative compared to the test. The differences in the tuning results shown in Table 3 are noticeable but not dramatic, proving that using one’s existing engineering experience with these parameters can support the earlier theoretical analysis.
In addition, the most crucial correction is the tire friction coefficient. The relationship curves of the friction coefficients and slip ratios in the test were obtained using the measured results of the vertical loads, longitudinal loads, tire speeds, and tire compressions. As shown in Figure 9, a vast difference can be seen compared with the theoretical curves in Figure 4. The aforementioned verification tests can only be completed if the above measurements are carried out.
4.3.2. Load Validation
The load comparison, which includes both the wheel-axle loads and ground-contact loads in the vertical and less-studied longitudinal directions, is to determine further the accuracy of the pre-analysis loads, theoretical model, and simulation tool to support accurate load analysis and structural design.
A new simulation analysis was conducted using the test conditions and tuned parameters as input data. Graphical comparisons of the results are shown in Figure 10. This figure shows that both the loads at the WA center and GC point and both the loads in the vertical and longitudinal directions were all in good agreement between the simulation and test, validating both the accuracy and comprehensiveness of the work previously performed. Compared with other studies on the drop test [4,8,17,32,33], the longitudinal tire loads are basically similar in shape, as are the vertical history loads, but the longitudinal loads of the wheel axle, as described before, were not obtained in previous tests. This test result proves that a significant load difference between the WA and GC exists and could motivate other researchers to conduct WA load research.
4.3.3. Performance Validation
A comparison of the performance indexes was carried out to obtain a higher confidence level than the preliminary loop to further confirm the feasibility of the landing gear design scheme. Design indexes from the test are summarized in Table 4. We have experimentally validated that the landing gear design can meet the relevant requirements. The maximum overload factor of 1.69 meets the requirement of 1.7. The minimum absorption efficiency of 65.9% meets the requirement of 65%. Compared with other studies published recently [4,8,17,33], in which the efficiencies ranged from 60% to 80%, the design of the nose landing gear described herein is adequate, and the properly designed oleo-pneumatic shock absorber has been proven to have stable performance.
5. Conclusions
The landing impact load design process of a nose landing gear for a civil passenger aircraft has been described in this study. The accuracy and reliability of the load design were analyzed and confirmed by means of mathematical modeling, preliminary simulation and analysis, a landing gear drop test, parameter correction, and test data processing. This process was proven to be able to accurately and comprehensively meet the relevant airworthiness requirements, providing an excellent example for further development in this area. From this study, three main conclusions can be drawn, and they are listed below, as are two additional points regarding this study’s implications for future research and suggestions for future research directions:
- The results of the drop test show that the landing simulation analysis model established by the assumption of the two masses (sprung and un-sprung), four degrees of freedom, and a rigid airframe can accurately analyze the landing impact loads.
- Through both the simulation and the test, the difference between the wheel-axle and the ground-contact loads was revealed to be non-negligible.
- If one takes reasonable consideration in the pre-test preparation of the structure’s stiffness and the during-test measurement of the wheel-axle loads, the drop test validation can be accurate and comprehensive, and both the vertical and the longitudinal loads, as well as the wheel-axle and ground-contact loads, can be fully validated.
- The importance of structural flexibility and tire friction modeling, as noted in this paper, should be considered in the current popular dynamic analysis methods based on ADAMS or other software, and the corresponding multi-body modeling methods can be further investigated to accurately analyze longitudinal loads.
- The lateral loads and the detailed attachment point loads may also need to be investigated further via both simulations and tests, including the motion equations for the lateral degrees of freedom, the lateral mechanics model of the tires, and the experimental validation of attachment point loads, especially for main landing gears with more complex asymmetric structures than the nose landing gear.
Author Contributions
Conceptualization, W.L. and Y.W.; methodology, W.L.; software, W.L. and Y.J.; validation, W.L.; formal analysis, W.L.; writing—original draft preparation, W.L.; writing—review and editing, Y.J. and Y.W.; supervision, Y.W. All authors have read and agreed to the published version of the manuscript.
Funding
The APC was funded by Shanghai Aircraft Design & Research Institute, China Commercial Aircraft Corporation, Shanghai 201210, China.
Data Availability Statement
Data are contained within the article.
Conflicts of Interest
The authors declare no conflict of interest. The funders had no role in the design of the study; in the collection, analyses, or interpretation of data; in the writing of the manuscript; or in the decision to publish the results.
References
- Currey, N.S.; American Institute of Astronautics. Aircraft Landing Gear Design: Principles and Practices; American Institute of Aeronautics and Astronautics: Washington, DC, USA, 1988. [Google Scholar]
- Pritchard, J. Overview of landing gear dynamics. J. Aircr. 2001, 38, 130–137. [Google Scholar] [CrossRef]
- Krüger, W.R.; Morandini, M. Recent developments at the numerical simulation of landing gear dynamics. CEAS Aeronaut. J. 2011, 1, 55–68. [Google Scholar] [CrossRef]
- Zhang, M.; Xiyang, W.; Zimin, Y.; Xiazheng, S. Six-wheel trolley type landing gear ground load analysis study. Xibei Gongye Daxue Xuebao/J. Northwest. Polytech. Univ. 2022, 40, 1090–1099. [Google Scholar] [CrossRef]
- Lernbeiss, R.; Ploechl, M. Simulation model of an aircraft landing gear considering elastic properties of the shock absorber. Proc. Inst. Mech. Eng. Part K J. Multi-Body Dyn. 2007, 221, 77–86. [Google Scholar] [CrossRef]
- Karam, W.; Maré, J.-C. Advanced model development and validation of landing gear shock struts. Proc. Inst. Mech. Eng. Part G J. Aerosp. Eng. 2009, 224, 575–586. [Google Scholar] [CrossRef]
- Haran, A.P.; Sivakumar, S. Mathematical model and vibration analysis of aircraft with active landing gears. J. Vib. Control JVC 2015, 21, 229–245. [Google Scholar]
- Rami, F.; Cezary, G.; Jan, H.S. Adaptable pneumatic shock absorber. J. Vib. Control 2018, 25, 107754631879553. [Google Scholar]
- Gan, S.; Fang, X.; Wei, X. Parametric Analysis on Landing Gear Strut Friction of Light Aircraft for Touchdown Performance. Appl. Sci. 2021, 11, 5445. [Google Scholar] [CrossRef]
- Pecora, R. A Rational Numerical Method for Simulation of Drop-Impact Dynamics of Oleo-Pneumatic Landing Gear. Appl. Sci. 2021, 11, 4136. [Google Scholar] [CrossRef]
- Jiao, F. Oil damping energy loss analysis of landing gear shock absorber. Proc. Inst. Mech. Eng. Part G J. Aerosp. Eng. 2019, 233, 3096–3106. [Google Scholar] [CrossRef]
- Baskaran, S.; Sivaprakasam, S. Friction analysis of aircraft landing gears due to landing impact. Proc. Inst. Mech. Eng. Part J J. Eng. Tribol. 2022, 236, 274–283. [Google Scholar] [CrossRef]
- Mahjouri, S.; Shabani, R.; Skote, M. Conceptual design of a new experimental setup to simulate aircraft tyre spin-up dynamics. Aircr. Eng. Aerosp. Technol. 2023, 95, 1268–1274. [Google Scholar] [CrossRef]
- McGehee, J.R.; Carden, H.D. Analytical Investigation of the Landing Dynamics of a Large Airplane with a Load-Control System in the Main Landing Gear; TP 1555; NACA: Washington, DC, USA, 1979. [Google Scholar]
- Wei, X.H.; Nie, H. New Method of Attenuating Landing Impact Force on Carrier-based Aircraft Landing Gear. Acta Aeronaut. Astronaut. Sin. 2007, 28, 324. [Google Scholar]
- Stachiw, T.; Khouli, F.; Langlois, R.G.; Afagh, F.F. Landing gear mechanical network synthesis for improving comfort at landing considering aircraft flexibility. J. Aircr. 2021, 58, 1242–1253. [Google Scholar] [CrossRef]
- Kang, B.-H.; Kim, B.-G.; Choi, S.-B. Aircraft landing gear system with magnetorheological shock strut: Performance evaluation via drop test. J. Intell. Mater. Syst. Struct. 2023, 34, 1045389X221147632. [Google Scholar] [CrossRef]
- Suresh, P.; Sura, N.K.; Shankar, K.; Radhakrishnan, G. Synthesis of landing dynamics on land-base high performance aircraft considering multi-variate landing conditions. Mech. Based Des. Struct. Mach. 2023, 51, 3945–3964. [Google Scholar] [CrossRef]
- Monclar, P. Landing gear technology programmes. In Proceedings of the AIAA International Air and Space Symposium and Exposition: The Next 100 Years, Dayton, OH, USA, 14–17 July 2003; p. 2505. [Google Scholar]
- Divakaran, V.; Kumar, G.; Rao, P.S. Aircraft landing gear design and development. Aircr. Land. Gear Des. Dev. 2015, 1, 1–12. [Google Scholar]
- Correia, D.; Ferreira, A. Aircrafts on-ground dynamics models and simulation software: State-of-the-art. Sustainability 2021, 13, 9147. [Google Scholar] [CrossRef]
- Richards, P.W.; Erickson, A. Dynamic Ground Loads Analysis Using Detailed Modeling of Landing Gear and Aircraft Aeroservoelastics. In Proceedings of the AIAA SciTech 2019 Forum, San Diego, CA, USA, 7–11 January 2019; p. 0759. [Google Scholar]
- McDonald, M.; Richards, P.W.; Walker, M.; Erickson, A.J. Carrier Landing Simulation using Detailed Aircraft and Landing. In Proceedings of the AIAA SciTech 2020 Forum, Orlando, FL, USA, 7–11 January 2020; p. 1138. [Google Scholar]
- Zhang, L.; Xue, C.J. A Landing Gear Drop Dynamic Simulation based on the LMS. Virtual. Lab. Appl. Mech. Mater. 2011, 55, 684–687. [Google Scholar] [CrossRef]
- Orlandea, N.V. Multibody systems history of ADAMS. J. Comput. Nonlinear Dyn. 2016, 11, 060301. [Google Scholar] [CrossRef]
- EASA. Certification Specifications and Acceptable Means of Compliance for Large Aeroplanes, CS-25 Amendment 27; European Union Aviation Safety Agency: Cologne, Germany, 2023. [Google Scholar]
- Holmes, G.; Sartor, P.; Reed, S.; Southern, P.; Worden, K.; Cross, E. Prediction of landing gear loads using machine learning techniques. Struct. Health Monit. 2016, 15, 568–582. [Google Scholar] [CrossRef]
- Flugge, W. Landing-Gear Impact; TN 2743; NACA: Washington, DC, USA, 1952. [Google Scholar]
- Caijun, X.; Xiuli, X.; Wengang, Q. Research on the performance of buffer for landing gear based on the drop test. J. Vibroeng. 2012, 14, 794–804. [Google Scholar]
- Norwood, D.S.; Chichester, R.H. Full scale aircraft drop test program for the F-35C carrier variant. In Proceedings of the 56th AIAA/ASCE/AHS/ASC Structures, Structural Dynamics, and Materials Conference, Kissimmee, FL, USA, 5–9 January 2015; p. 0459. [Google Scholar]
- Zhang, Z.; Wei, X.; Ye, Q. Heading Load Dynamic Simulation of Landing Gear Test. In Proceedings of the 2018 Asia-Pacific International Symposium on Aerospace Technology (APISAT 2018) 9th, Singapore, 14–19 July 2019; Springer: Berlin/Heidelberg, Germany, 2019; pp. 1469–1476. [Google Scholar]
- Fang, W.; Zhu, L.; Wang, Y. Landing Performance Study for Four Wheels Twin Tandem Landing Gear Based on Drop Test. Aerospace 2022, 9, 334. [Google Scholar] [CrossRef]
- Gao, Z. Aircraft Design Manual: Volume 14, Take-Off and Landing System Design; Aviation Industry Press: Beijing, China, 2001. [Google Scholar]
- Wang, H.; Wu, D.; Wang, F.; Ren, H. A method for determining the horizontal impact load based on the rotational speed of the aircraft’s wheel in a landing gear drop test. Int. J. Crashworthiness 2018, 23, 627–634. [Google Scholar] [CrossRef]
- Son, L.; Bur, M.; Rusli, M. A new concept for UAV landing gear shock vibration control using pre-straining spring momentum exchange impact damper. J. Vib. Control 2018, 24, 1455–1468. [Google Scholar] [CrossRef]
- Chester, D. The equivalent masses at nose landing-gears during landing-impacts and when taxiing over runway perturbations. In Proceedings of the 27th Israel Annual Conference on Aviation and Astronautics, Haifa, Israel, 27–28 February 1985; Volume 27. Collection of Papers. [Google Scholar]
Figure 1.
Landing gear and shock absorber: (a) nose landing gear structure; (b) internal schematic of shock absorber.
Figure 1.
Landing gear and shock absorber: (a) nose landing gear structure; (b) internal schematic of shock absorber.

Figure 2.
Landing gear dynamic model.

Figure 3.
MATLAB/Simulink model.

Figure 4.
Landing gear design parameters.

Figure 5.
Vertical load versus sprung mass travel.

Figure 6.
Time history load comparison of WA and GC: (a) case A1; (b) case A2; (c) case A3.

Figure 7.
Landing gear drop test facility.

Figure 8.
FEM model.

Figure 9.
Tire friction coefficient.

Figure 10.
Load comparison between the simulation and test: (a) WA loads of case 1; (b) GC loads of case 1; (c) WA loads of case 2; (d) GC loads of case 2; (e) WA loads of case 3; (f) GC loads of case 3.
Figure 10.
Load comparison between the simulation and test: (a) WA loads of case 1; (b) GC loads of case 1; (c) WA loads of case 2; (d) GC loads of case 2; (e) WA loads of case 3; (f) GC loads of case 3.


Table 1.
Preliminary analysis cases.
| Preliminary Analysis Case | A1 | A2 | A3 |
|---|---|---|---|
| Reduced mass (kg) | 13,400 | 13,400 | 13,400 |
| Sinking speed (m/s) | 3.05 | 3.05 | 3.05 |
| Longitudinal speed (m/s) | 0 | 58 | 96 |
Table 2.
Energy criteria results.
| Test Case | T1 | T2 | T3 |
|---|---|---|---|
| Reduced Mass (kg) | 13,472 | 13,472 | 13,472 |
| Sinking Speed (m/s) | 3.10 | 3.08 | 3.08 |
| Longitudinal Speed (m/s) | 0 | 58.6 | 96.5 |
Table 3.
Parameter tuning results.
| Key Factor | Pre. | T1 | T2 | T3 | Tuned |
|---|---|---|---|---|---|
| Gas polytrophic (−) | 1.1 | 1.13 | 1.05 | 1.12 | 1.08 |
| Oil discharging (−) | 0.8 | 0.82 | 0.84 | 0.79 | 0.8 |
| Bearing friction (−) | 5% | 5% | 9% | 8% | 7% |
| Tire dynamic (−) | 1.08 | 1.04 | 0.97 | 1.07 | 1.08 |
Table 4.
Performance indexes of test.
| Performance Index | T1 | T2 | T3 |
|---|---|---|---|
| Load factor (−) | 1.69 | 1.62 | 1.63 |
| Absorption efficiency (−) | 65.9% | 67.8% | 67.4% |
Disclaimer/Publisher’s Note: The statements, opinions and data contained in all publications are solely those of the individual author(s) and contributor(s) and not of MDPI and/or the editor(s). MDPI and/or the editor(s) disclaim responsibility for any injury to people or property resulting from any ideas, methods, instructions or products referred to in the content. |
© 2023 by the authors. Licensee MDPI, Basel, Switzerland. This article is an open access article distributed under the terms and conditions of the Creative Commons Attribution (CC BY) license (https://creativecommons.org/licenses/by/4.0/).
Share and Cite
MDPI and ACS Style
Liu, W.; Wang, Y.; Ji, Y. Landing Impact Load Analysis and Validation of a Civil Aircraft Nose Landing Gear. Aerospace 2023, 10, 953. https://doi.org/10.3390/aerospace10110953
AMA Style
Liu W, Wang Y, Ji Y. Landing Impact Load Analysis and Validation of a Civil Aircraft Nose Landing Gear. Aerospace. 2023; 10(11):953. https://doi.org/10.3390/aerospace10110953
Chicago/Turabian StyleLiu, Wenbin, Youshan Wang, and Yuchen Ji. 2023. "Landing Impact Load Analysis and Validation of a Civil Aircraft Nose Landing Gear" Aerospace 10, no. 11: 953. https://doi.org/10.3390/aerospace10110953
Note that from the first issue of 2016, this journal uses article numbers instead of page numbers. See further details here.