Markets
Visualizing Who Holds U.S. Debt Internationally
Visualizing Who Holds U.S. Debt Internationally
We recommend viewing the full-size version of today’s infographic by clicking here.
Everyone knows that the U.S. Federal Government has roughly $20 trillion of debt. A question we often get, however, is who exactly owns all these treasuries? And if it’s held abroad by countries like China, what portion do they hold?
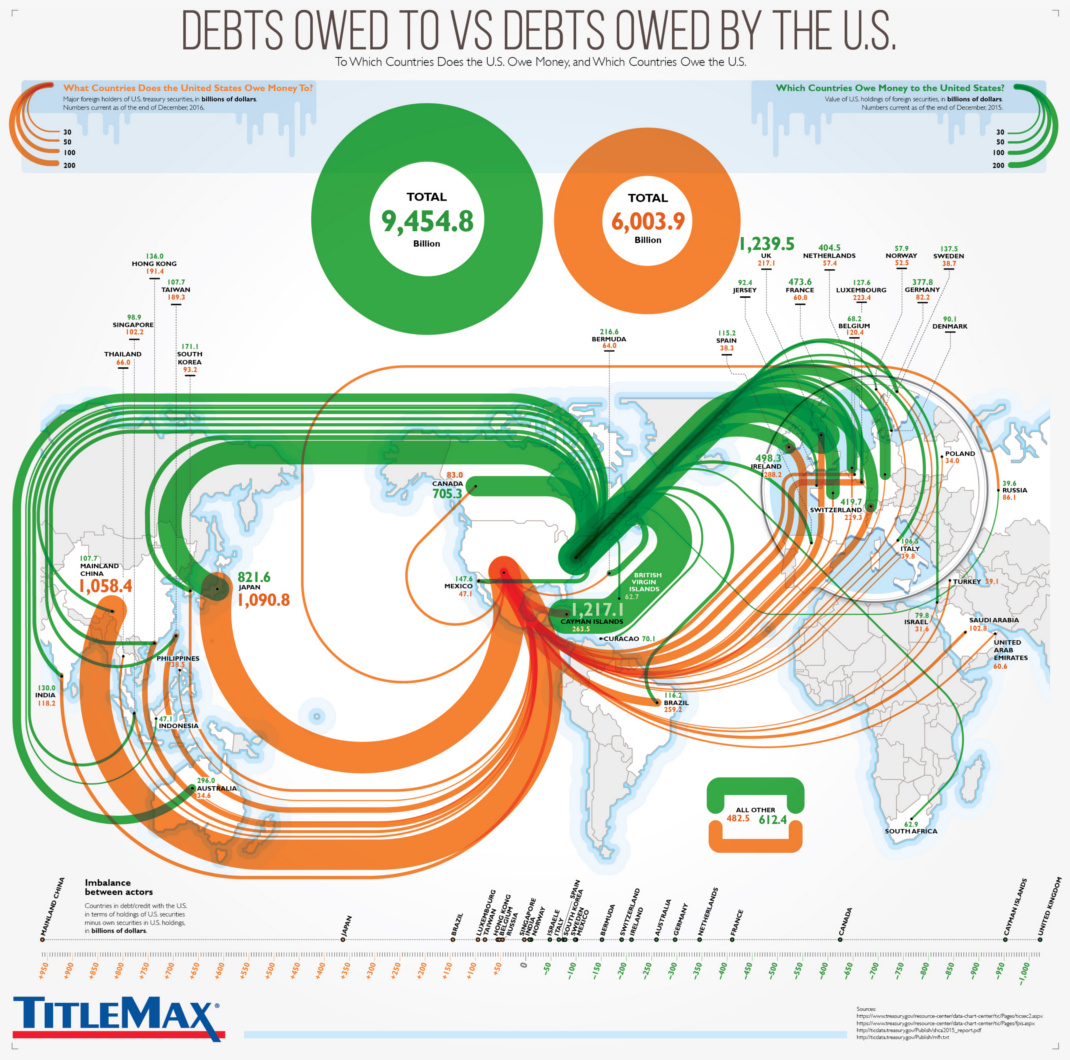
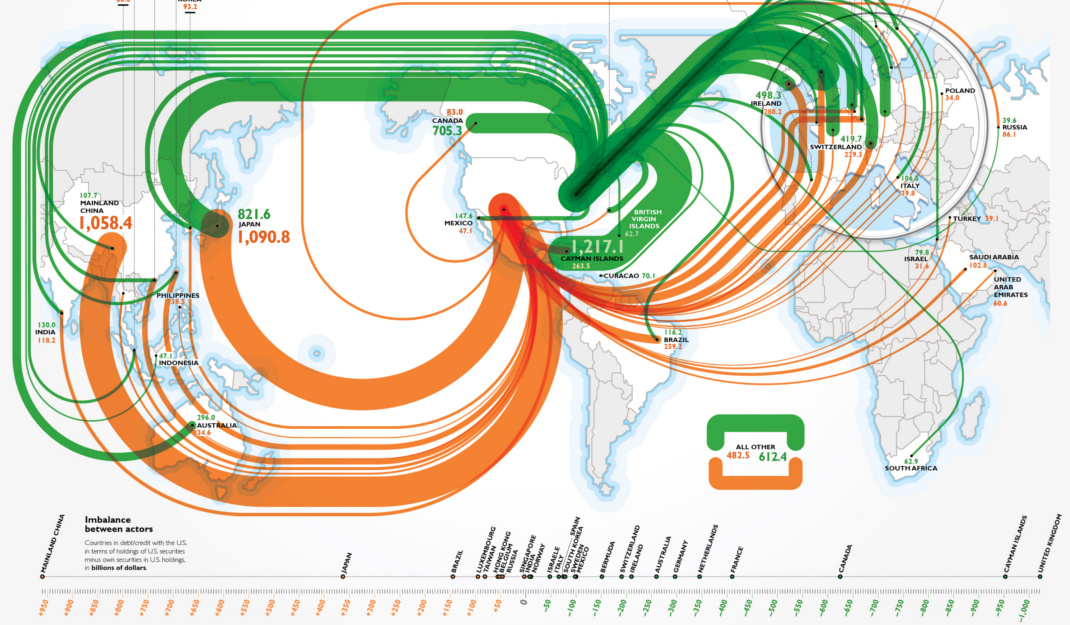
Today’s infographic comes from TitleMax, and it looks at who owns U.S. debt internationally, as well as the debt from other countries that is held by the U.S.
Who Holds U.S. Debt?
Federal government debt in the United States can be broadly placed in two categories: “Debt held by the public” and “Intragovernmental debt”. The former category includes securities held by individual investors, corporations, local and state governments, the Federal Reserve, and foreign governments.
Meanwhile, intragovernmental debt includes securities held in accounts administered by other federal authorities. This category, for example, would include treasuries owed to the Social Security Trust Fund.
Here’s the tallies of these two categories as of December 2016:
| Federal U.S. Debt (Billions) | |
|---|---|
| Debt held by the public | $14,202.1 |
| Intragovernmental debt | $5,395.7 |
| Total debt | $19,597.8 |
Debt Held By the Public
“Debt held by the public” is the most interesting of these, and it can be further broken down:
| Entity | U.S. Debt Held (Billions) |
|---|---|
| Foreign/International | $6,154.9 |
| Federal Reserve* | $2,490.6 |
| Mutual Funds | $1,524.8 |
| State and Local Gov'ts (incl. pensions) | $899.4 |
| Banks | $620.3 |
| Private pension funds | $549.1 |
| Insurance Companies | $344.8 |
| U.S. Savings Bonds | $165.8 |
| Other | $1,449.1 |
*Note: Data for Fed is for marketable securities only. All data in this table from September 2016.
About 43% of all debt held by the public is actually owned by foreign governments, corporations, and individuals.
U.S. Debt Held Internationally
Here’s how that breaks down by country:
| Country | U.S. Debt Held (Billions) |
|---|---|
| Japan | $1,090.8 |
| China | $1,058.4 |
| Ireland | $288.2 |
| Cayman Islands | $263.5 |
| Brazil | $259.2 |
| Switzerland | $229.9 |
| Luxembourg | $223.4 |
| United Kingdom | $217.1 |
| Hong Kong | $191.4 |
| Taiwan | $189.3 |
| India | $118.2 |
| Saudi Arabia | $102.8 |
| Others | $1,771.7 |
Note: This data is from December 2016


Maps
Mapped: The 10 U.S. States With the Lowest Real GDP Growth
In this graphic, we show where real GDP lagged the most across America in 2023 as high interest rates weighed on state economies.


The Top 10 U.S. States, by Lowest Real GDP Growth
This was originally posted on our Voronoi app. Download the app for free on iOS or Android and discover incredible data-driven charts from a variety of trusted sources.
While the U.S. economy defied expectations in 2023, posting 2.5% in real GDP growth, several states lagged behind.
Last year, oil-producing states led the pack in terms of real GDP growth across America, while the lowest growth was seen in states that were more sensitive to the impact of high interest rates, particularly due to slowdowns in the manufacturing and finance sectors.
This graphic shows the 10 states with the least robust real GDP growth in 2023, based on data from the Bureau of Economic Analysis.
Weakest State Economies in 2023
Below, we show the states with the slowest economic activity in inflation-adjusted terms, using chained 2017 dollars:
| Rank | State | Real GDP Growth 2023 YoY | Real GDP 2023 |
|---|---|---|---|
| 1 | Delaware | -1.2% | $74B |
| 2 | Wisconsin | +0.2% | $337B |
| 3 | New York | +0.7% | $1.8T |
| 4 | Missississippi | +0.7% | $115B |
| 5 | Georgia | +0.8% | $661B |
| 6 | Minnesota | +1.2% | $384B |
| 7 | New Hampshire | +1.2% | $91B |
| 8 | Ohio | +1.2% | $698B |
| 9 | Iowa | +1.3% | $200B |
| 10 | Illinois | +1.3% | $876B |
| U.S. | +2.5% | $22.4T |
Delaware witnessed the slowest growth in the country, with real GDP growth of -1.2% over the year as a sluggish finance and insurance sector dampened the state’s economy.
Like Delaware, the Midwestern state of Wisconsin also experienced declines across the finance and insurance sector, in addition to steep drops in the agriculture and manufacturing industries.
America’s third-biggest economy, New York, grew just 0.7% in 2023, falling far below the U.S. average. High interest rates took a toll on key sectors, with notable slowdowns in the construction and manufacturing sectors. In addition, falling home prices and a weaker job market contributed to slower economic growth.
Meanwhile, Georgia experienced the fifth-lowest real GDP growth rate. In March 2024, Rivian paused plans to build a $5 billion EV factory in Georgia, which was set to be one of the biggest economic development initiatives in the state in history.
These delays are likely to exacerbate setbacks for the state, however, both Kia and Hyundai have made significant investments in the EV industry, which could help boost Georgia’s manufacturing sector looking ahead.

-

 United States6 days ago
Mapped: Countries Where Recreational Cannabis is Legal
-

 Healthcare2 weeks ago
Life Expectancy by Region (1950-2050F)
-

 Markets2 weeks ago
The Growth of a $1,000 Equity Investment, by Stock Market
-

 Markets2 weeks ago
Mapped: Europe’s GDP Per Capita, by Country
-

 Money2 weeks ago
Charted: What Frustrates Americans About the Tax System
-

 Technology2 weeks ago
Countries With the Highest Rates of Crypto Ownership
-

 Mining2 weeks ago
Where the World’s Aluminum is Smelted, by Country
-

 Personal Finance2 weeks ago
Visualizing the Tax Burden of Every U.S. State