“Someone smarter than me find the reason these two graphs don’t line up.”
Is the question du jour. The graphs are as follows:
Graph 1.

And…
Graph 2.

I don’t pretend to be smarter than the individual that asked it (far from it), but I’ll take a crack at it. It will be tricky without the underlying data sets, but I’ll probably meander off on a tangent anyway as I am prone to do.
Firstly it’s worth noting that the scales and the base years on the charts are different. Base years are used by economists to make intertemporal comparisons between data sets. This is significant, because, as documented here, comparing nominal figures over time does not take inflation into account.
In short, one chart is inflation adjusted with 2014 as a reference and the other is inflation adjusted with 1982 as a reference. That cannot be discounted.
It’s also worth noting that Graph 1 has a percentage scale on the vertical axis, Graph 2 shows dollars. Graph 2 is an aggregated data series (an average- while not specified I assume the mean) which means there is specific data lost.
Why does Graph 1 show a rise in wages while Graph 2 shows a relative decline in two of the three brackets? What you’re witnessing is a shift in the distribution of income.
So let’s look at US real wages, and US income distribution.
US Real Wages vs. Productivity
According to the US Bureau of Labor Statisitcs, there has been a significant divergence between worker productivity and worker real wages in the US since the 1970s.

In short, the US workers have been producing more and more goods, but getting paid a more or less flat rate for it. So why is this happening? Let’s dig deeper.
Economists such as Paul Krugman have looked at this in quite a lot of depth. I’ve taken a random Harvard paper from the Journal of Economic Perspectives, BUT, if you search academic literature you’ll find Krugman’s paper (which all of these subsequent papers reference anyway). Figure 1, below is from page 122.
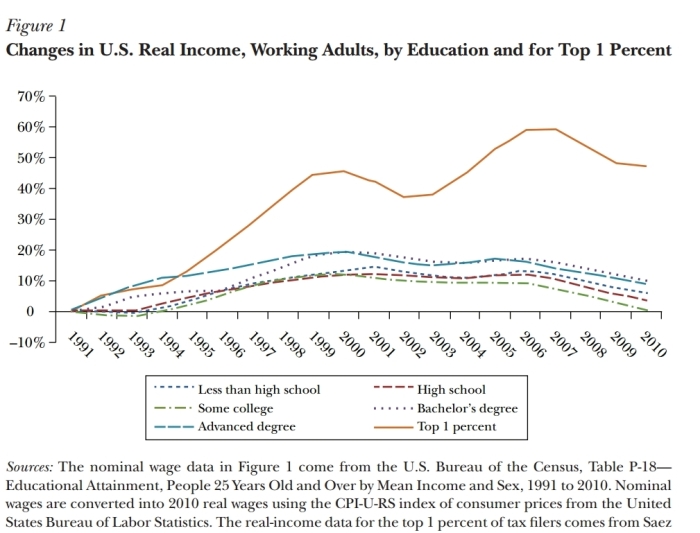
Which shows the extreme divergence between the “ownership” (equity) portion of the US population, and everyone else. In essence, the aggregation of the data shows real wage increases because the “top 1 percent” have been increasing their income at a greater rate than everyone else. Obviously this is part of the 99% rally and the “Occupy Wall-Street” movement.
This goes hand in hand with capital stock accumulation and technology. Which accounts for the lion’s share of the productivity growth. Economists have also shown a significant divergence between “routine” and “non-routine” job tasks too. Routine tasks tend to be more easily automated.
This is bad right?
Well.. yes, and no. This is bad in the sense that it leads to resentment and social instability amongst the underlying population. It’s also bad in the sense that the poorest members of society tend (not always, but tend) to be the ones more likely to consume and drive the economy forward. It’s entirely plausible that what we are witnessing is the absolute zenith of Capitalism in the West. There’s no question that wealth will need to be redistributed and job skills will need to improve (in general) before more economic growth can be obtained. Note: wealth will be distributed as part of the market mechanism, government doesn’t need to stick their nose in, though it will be a volatile and distressing time. It’s also likely we’ll need fundamental shifts in technology levels.
On the other hand, while wages have been falling, the basic necessities in the cost of living also decreased for a while. Food, water, oil, gas, cars etc. This is because technological progress is largely deflationary.
A really volatile economic cocktail tends to be rising real costs of living, and declining real wage growth. I suspect this is what tends to lead to the downfall of many historical empires.
Can we just tax the rich and give to the poor?
Some governments are trying to do just that, including a local government near me. Unfortunately, this won’t really help much in any capacity other than to mitigate risk of a revolution in the short-term. I have no doubt that a lot of the super-wealthy can afford to be taxed, and a lot of poor people need wealth, but the type of fundamentals in the economy that are needed to get on the right side of this trend again just won’t be in place.
Also keep in mind, giving poor people cash will most likely cause inflation, which will raise the real cost of living, without a corresponding reduction in the underlying costs of production.
About the only way people in real productive jobs can get a break and stay afloat is if we cut taxes, or reduce interest extracted from the economy. Reduce the economic inefficiencies posed by Government. I don’t mean this in the sense of “no government” (ie: anarchy), that would be madness. I mean this in the sense of, more return on taxpayer investment. A more efficient government.
There are also likely to be market inefficiencies also, which again, I would blame poor governance on. If we’re bailing out failing businesses, we’re throwing good wealth after bad. If we’re not regulating overly large businesses (monopolists, cartels etc.), again, we’re failing to govern as a nation. Argue about corruption and corporations etc. but it still comes down to the moral compass of the individuals with power.
Even that might not be enough, because it’s about what we do with that saved wealth, which raises questions like.. where it is invested, if it’s invested successfully, and what type of benefits this yields (if it’s even invested at all.) We’d like low-risk; high reward technological investment ideally. However, high risk; low reward technological investment is better than a potential revolution and wholesale destruction of property rights.
Hopefully that helps.

Chart #2, and what you’ve written here, is what I’ve thought was the case.
Chart #1 is confusing for me. It comes from this article: http://fee.org/anythingpeaceful/3-charts-on-the-disappearing-middle-class/
LikeLike
Interesting. I’ll need to dig into the data sets and the methodology expressed in the referenced post. Let me take a deeper look.
LikeLike